How Much Will This Stock Actually Move?
Stryke calculates the options-implied expected move for every US stock and ETF, including the post-earnings reaction, so you size strikes around what the market actually believes.
No credit card required
How Stryke calculates it
- Pulls the at-the-money straddle price from the live chain
- Cross-checks against the at-the-money implied volatility scaled by time to event
- Updates intraday as IV and the underlying move
- Reports both a percentage and a dollar move, with the implied price range
How to use it
- Set wing strikes for iron condors at the edge of the expected move
- Size short premium positions so the breakeven sits outside one standard deviation
- Compare the implied move to historical earnings reactions to spot mispricings
- Cross-reference with Stock Score and IV Rank before committing capital
Our proprietary tools
Built for traders who want institutional-grade screening without the institutional price tag. Live data, real Greeks, real volatility, all in one place.
FAQ
What is the expected move?
The expected move is the magnitude of price move the options market is pricing in over a given window, derived from at-the-money implied volatility and the at-the-money straddle.
How is it calculated?
Stryke uses the standard approximation: stock price multiplied by implied volatility multiplied by the square root of days-to-event over 365. It is cross-checked against the at-the-money straddle price.
How accurate is it for earnings?
Historically the actual move falls inside the expected move about two-thirds of the time, which is exactly what a one standard deviation reading should produce.
Where can I see it?
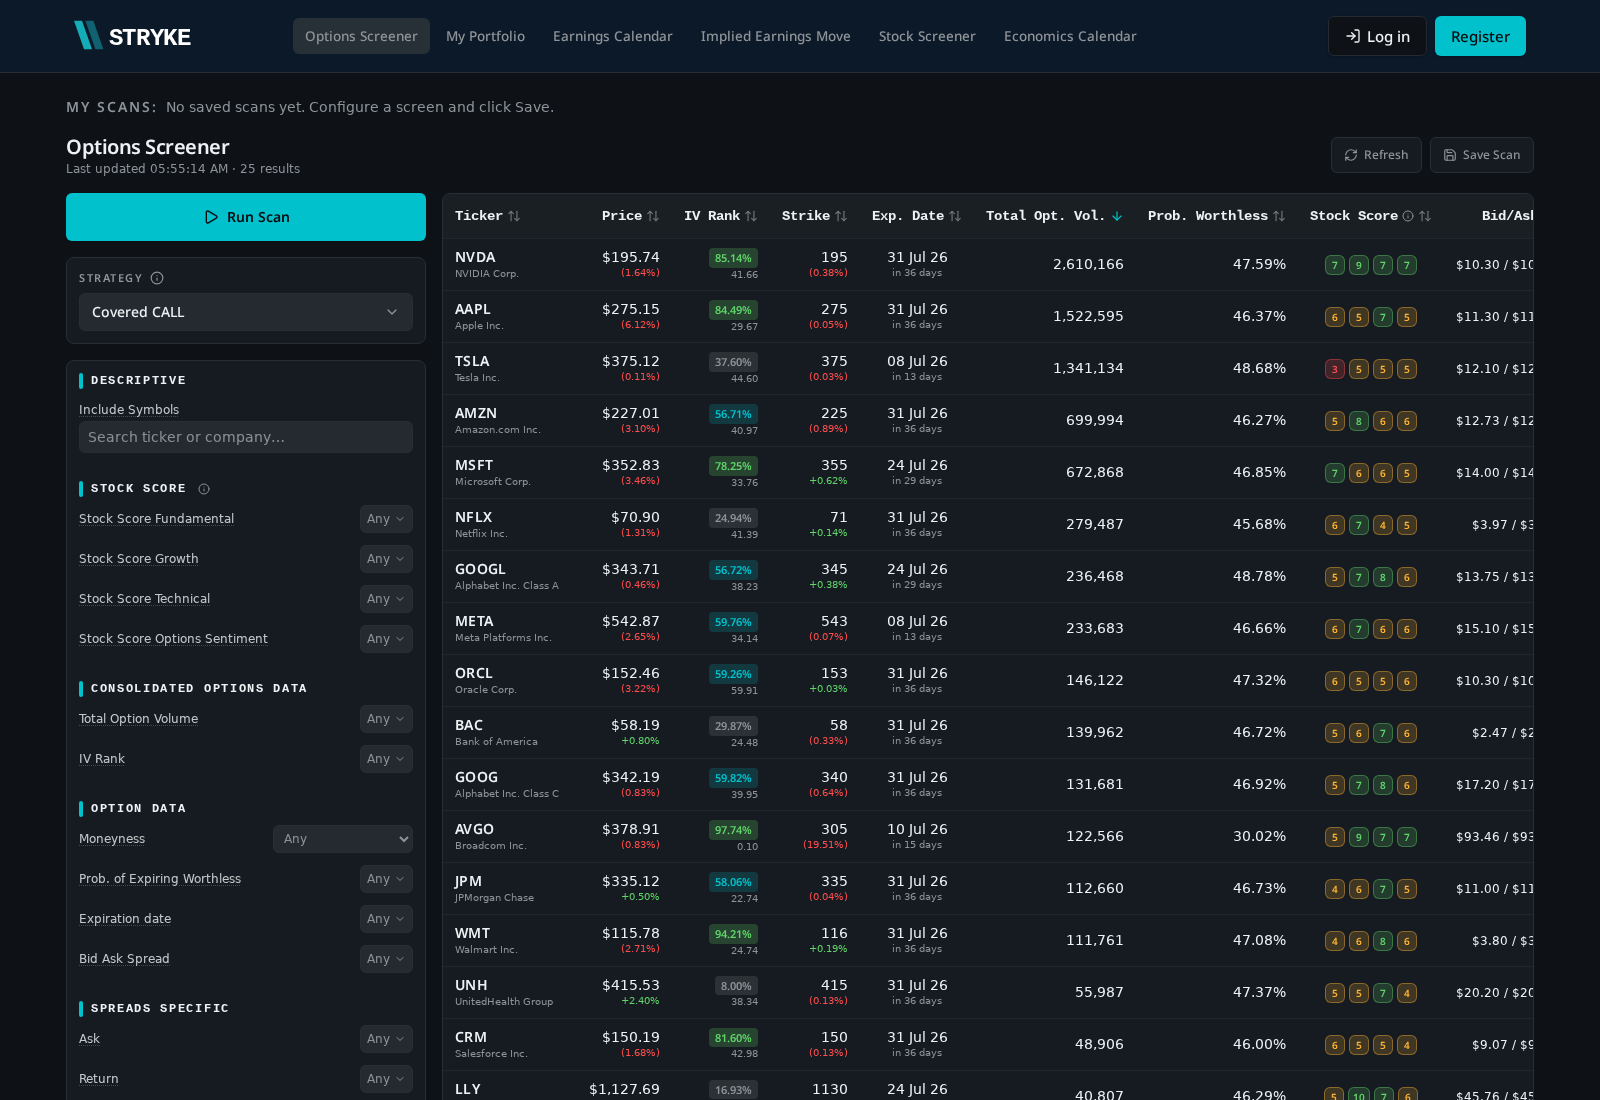
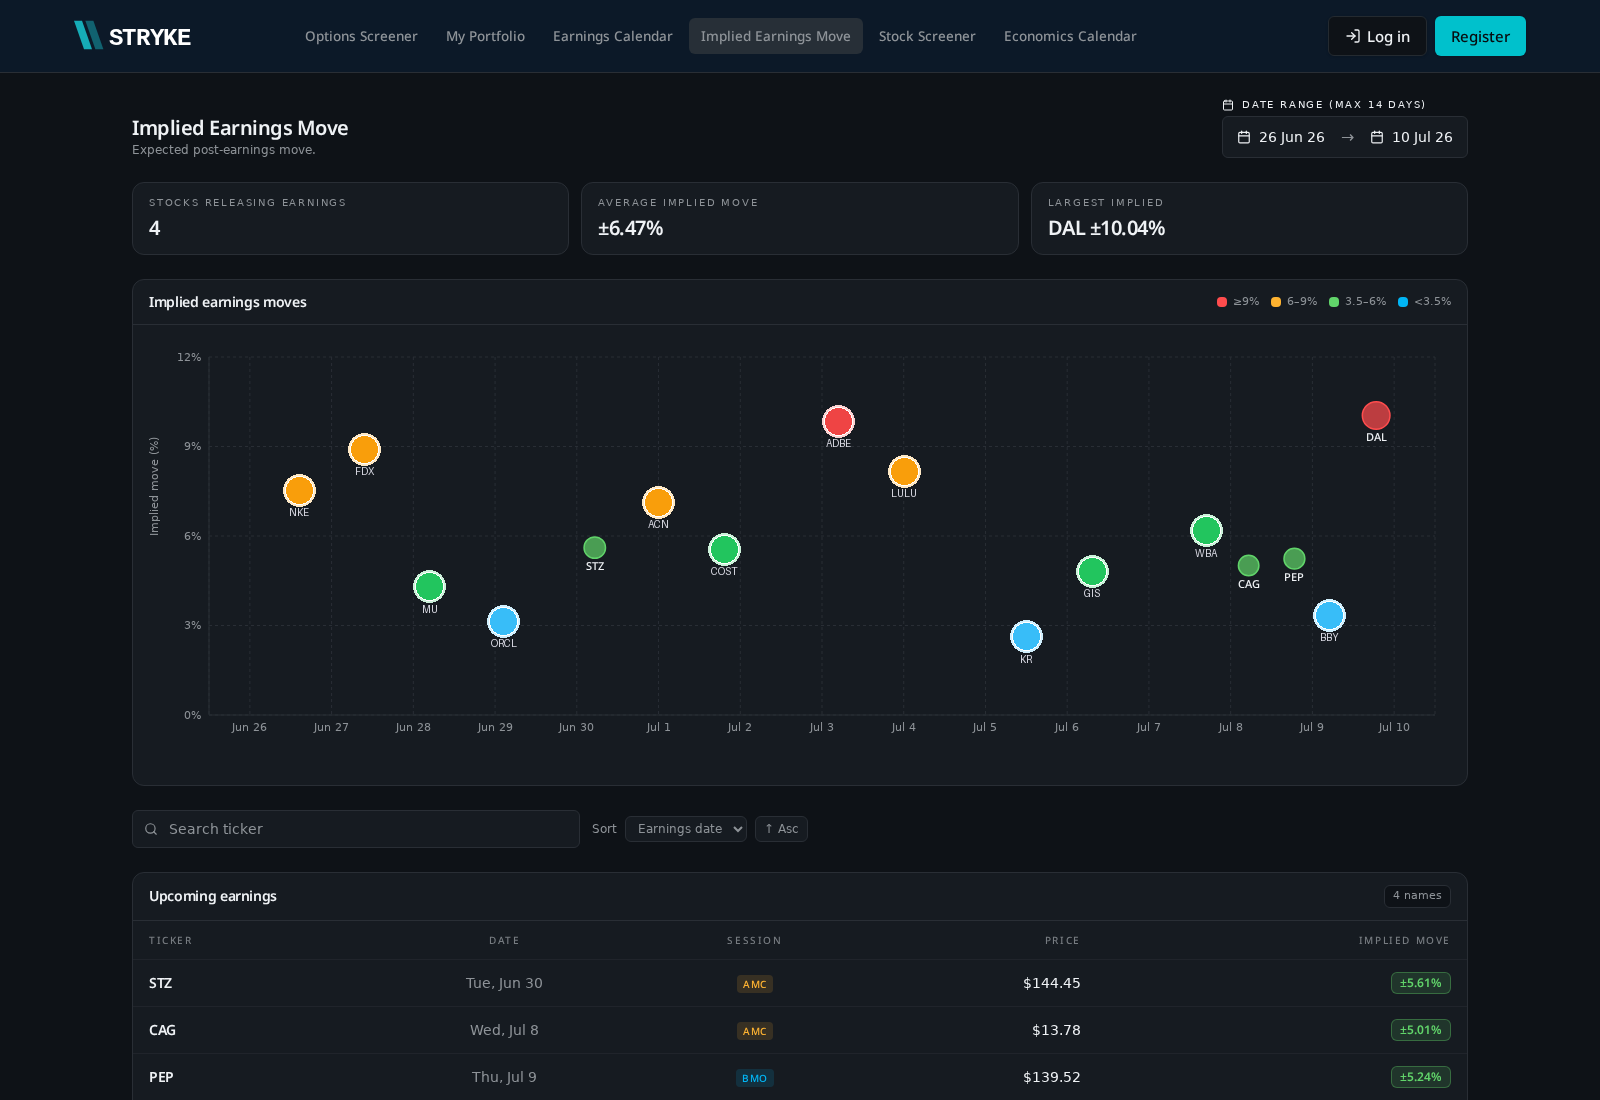
The Implied Earnings Move page shows the expected move for every name reporting in the next two weeks. The Options Screener shows it per strike when you build a setup.
Ready to find your edge?
Join traders using Stryke to surface opportunities across the US options market