Know When Options Are Cheap and When They Are Rich
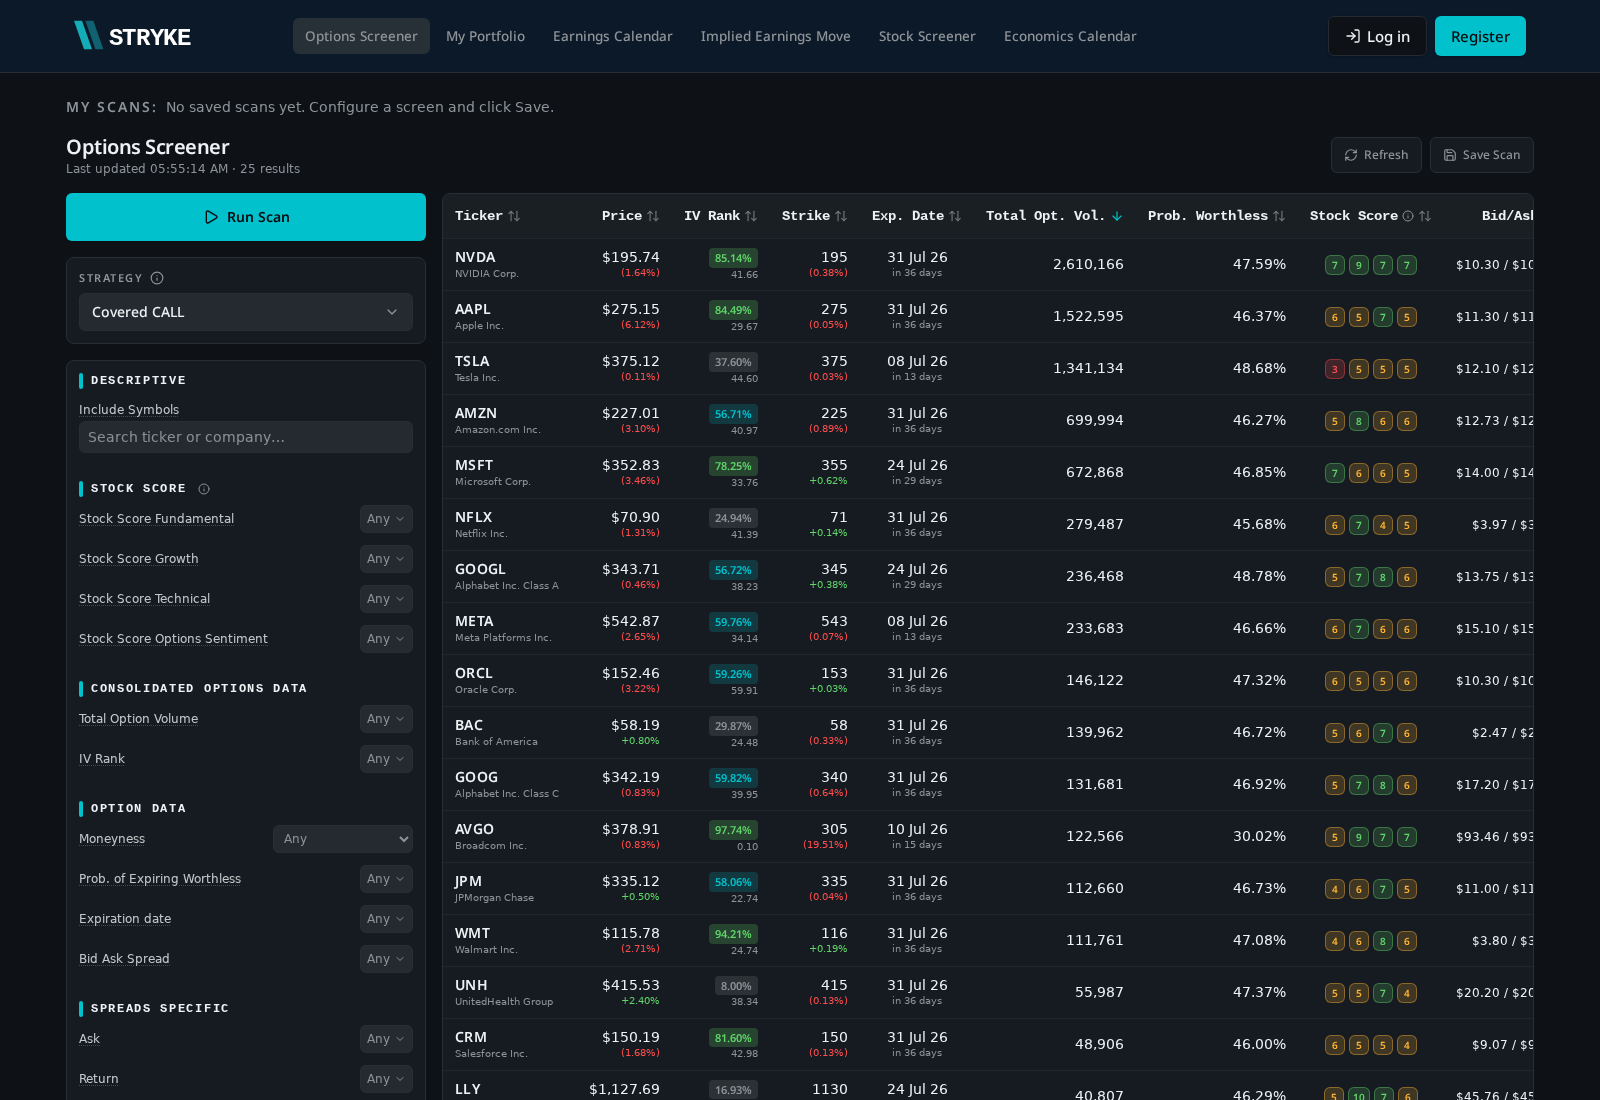
Stryke tracks Implied Volatility Rank for every US stock and ETF in real time, so you can sell premium when it pays and buy it when it does not.
No credit card required
How to read it
- Above 50: options are pricier than usual, premium selling has an edge
- Below 30: options are unusually cheap, debit spreads and long premium look better
- Spikes after macro or earnings events: opportunity for short-dated premium plays
- Steady drift higher: building stress that often resolves into a move
Where it lives in Stryke
- Stock Screener column for every US name in the universe
- Options Screener filter so you can target high or low IV Rank names directly
- Live updates intraday during regular trading hours
- Paired with Stock Score so volatility never gets read in isolation
Our proprietary tools
Built for traders who want institutional-grade screening without the institutional price tag. Live data, real Greeks, real volatility, all in one place.
FAQ
What is Implied Volatility Rank?
IV Rank measures where current implied volatility sits inside the past 52 weeks. A reading of 100 means IV is at its yearly high, 0 means it is at its yearly low.
How is IV Rank different from IV Percentile?
IV Rank uses the 52-week high and low as anchors, while IV Percentile counts the share of days IV was lower. Stryke shows both so you can pick the lens you trust.
Why does it matter for trading?
Selling premium is statistically more profitable when IV Rank is elevated. Buying premium tends to work better when IV Rank is low and a volatility expansion is likely.
How often does Stryke update IV Rank?
IV Rank refreshes through the session as live options chains move. The 52-week reference window rolls forward each trading day.
Ready to find your edge?
Join traders using Stryke to surface opportunities across the US options market