Spot Unusual Options Activity Before the Crowd
Track volume spikes, block trades, and outsized open interest changes across US equities and ETFs in real time.
No credit card required
What counts as unusual
- Contract volume that is several multiples of its trailing average
- Volume that exceeds existing open interest, suggesting new positioning
- Block prints near the ask (bullish flow) or bid (bearish flow)
- Repeated sweeps across multiple exchanges within minutes
How Stryke surfaces it
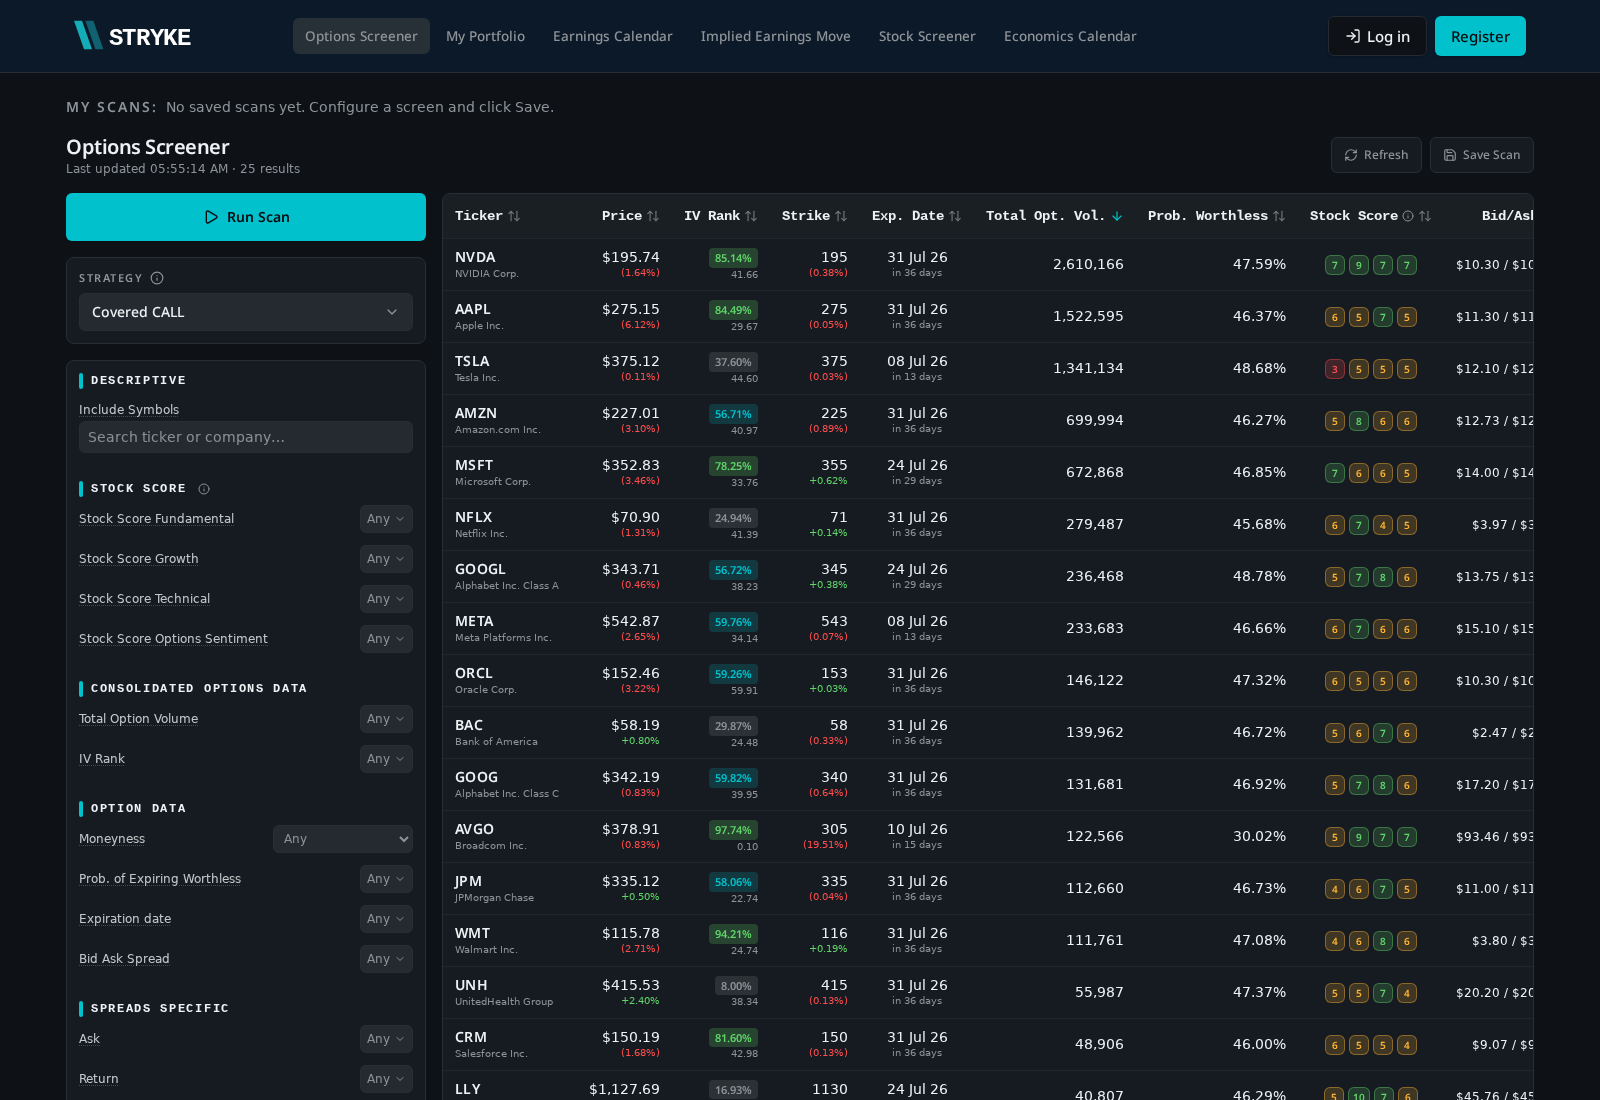
The screener pulls live chains, ranks contracts by activity score, and exposes filters for delta, days to expiry, and volume to open interest ratio. Pair it with the IV Rank column to find names where options are unusually active and the broader volatility is also stretched.
Our proprietary tools
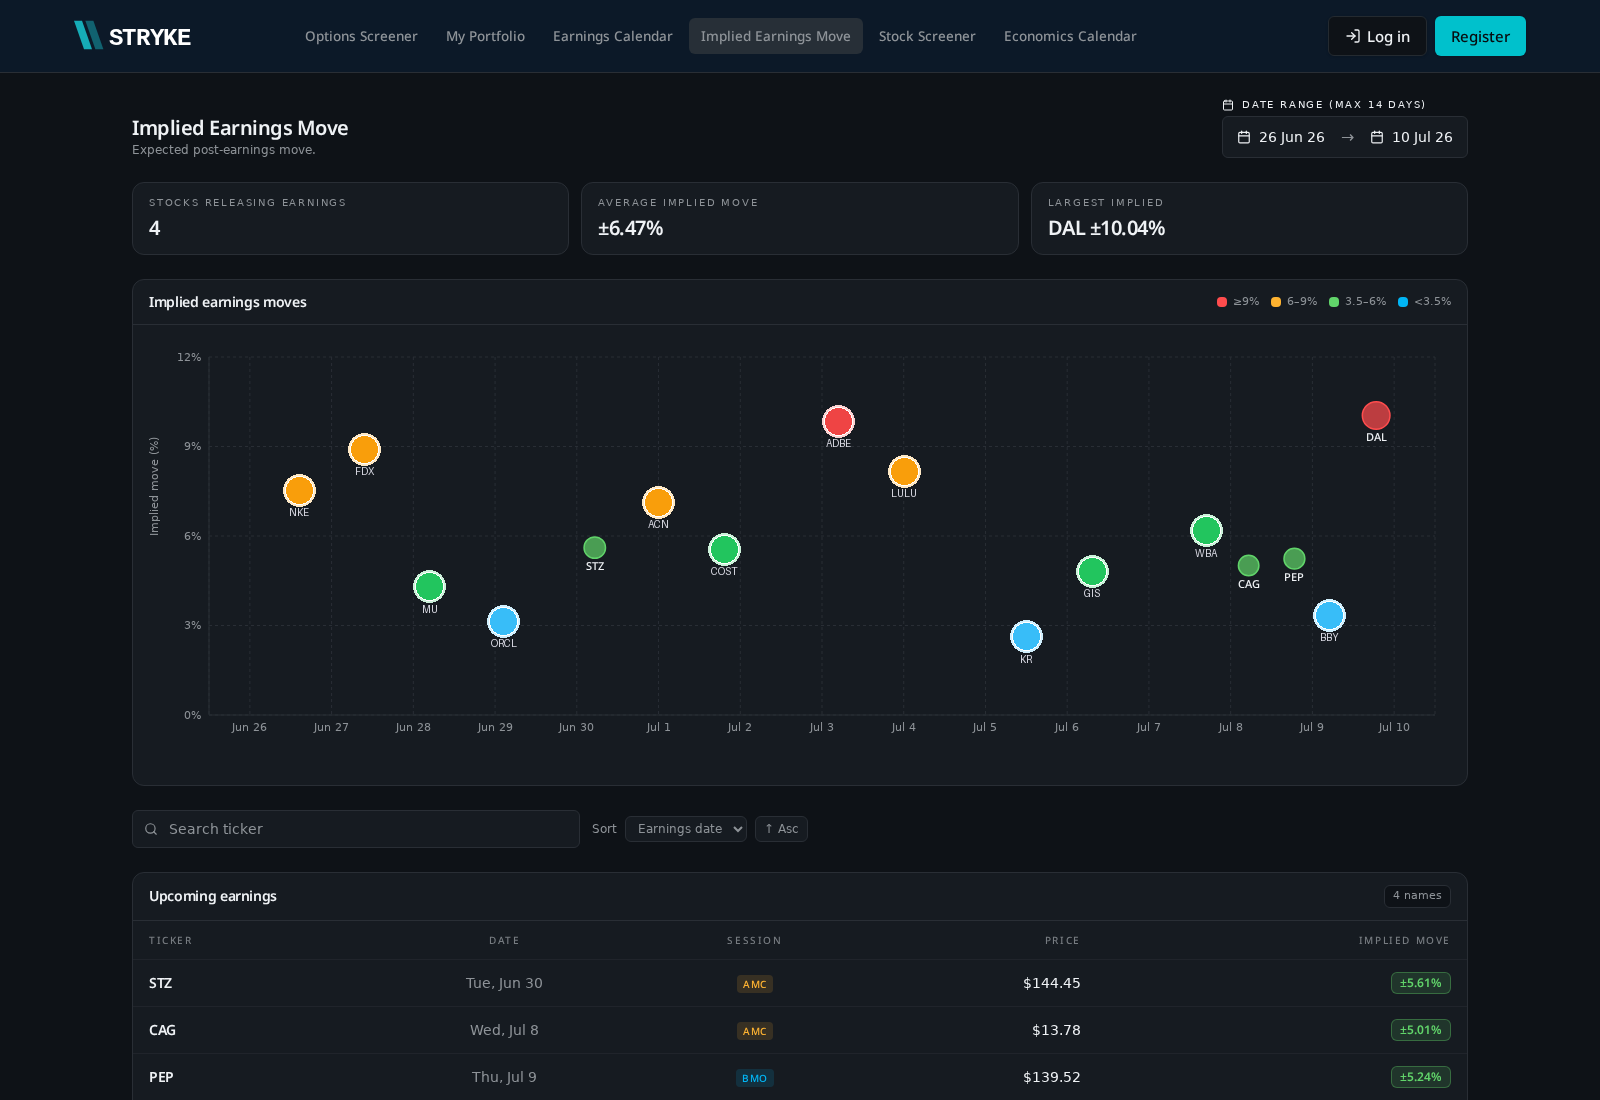
Built for traders who want institutional-grade screening without the institutional price tag. Live data, real Greeks, real volatility, all in one place.
FAQ
What is unusual options activity?
Unusual options activity describes contracts trading at volumes well above their typical level, often a multiple of average daily volume or open interest. Traders watch it as a possible signal of informed positioning before earnings, news, or large moves.
How does Stryke detect unusual activity?
Stryke compares each contract's intraday volume to its trailing average and open interest, flags volume to open interest ratios above one, and highlights block prints near the ask or bid for sentiment context.
Is unusual options activity a reliable signal?
It is one input, not a standalone signal. Combine it with implied volatility rank, the underlying's technical setup, and upcoming catalysts like earnings before acting.
Does Stryke cover ETFs and indexes?
Yes. The scanner runs across the US equity and ETF universe including SPY, QQQ, IWM, and major sector ETFs.
Ready to find your edge?
Join traders using Stryke to surface opportunities across the US options market